CryoTEMPO: Assessing Ice and Sea Level Dynamics near Petermann Glacier, Greenland
Introduction
In this example notebook, we use the CryoTEMPO Land Ice, Sea Ice and Polar Oceans data stored in Specklia to investigate the dynamics of Petermann Glacier and its surrounding environment over 12 years.
Petermann Glacier, one of Greenland’s largest marine-terminating glaciers, has experienced significant thinning in recent decades, leading to substantial loss of its floating ice shelf through calving events. These changes hold implications for sea level rise.
Petermann Glacier discharges into the Nares Strait, a critical pathway for sea ice exiting the Arctic. The glacier’s ice shelf is seasonally shielded by sea ice in this pathway. However, with the thinning of sea ice, it becomes more susceptible to faster floes, potentially increasing glacier calving rates.
This notebook aims to compare the long-term trends of sea-level fluctuations, sea ice thickness, and land ice thickness in and around Petermann Glacier using CryoSat’s CryoTEMPO products.
You can view the code below or click here to run it yourself in Google Colab!
Environment Setup
To run this notebook, you will need to make sure that the folllowing packages are installed in your python environment (all can be installed via pip/conda):
matplotlib
geopandas
contextily
ipykernel
shapely
specklia
If you are using the Google Colab environment, these packages will be installed in the next cell. Please note this step may take a few minutes.
[1]:
import sys

if "google.colab" in sys.modules:
    %pip install rasterio --no-binary rasterio
    %pip install specklia
    %pip install matplotlib
    %pip install geopandas
    %pip install contextily
    %pip install shapely
    %pip install python-dotenv
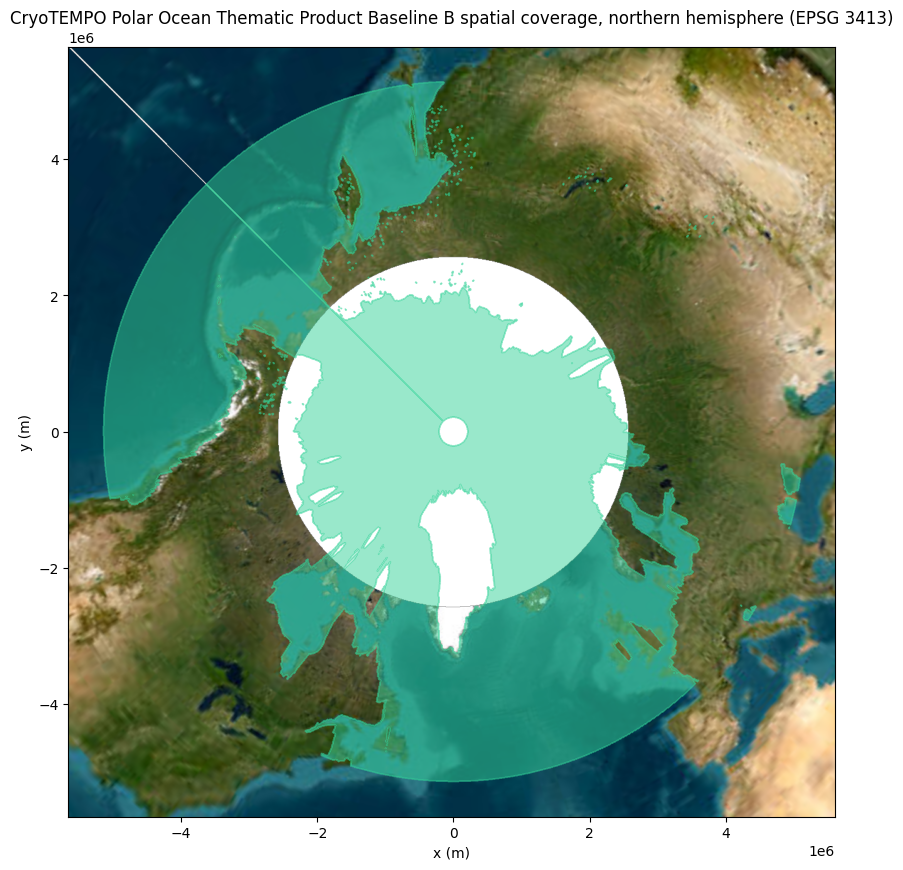
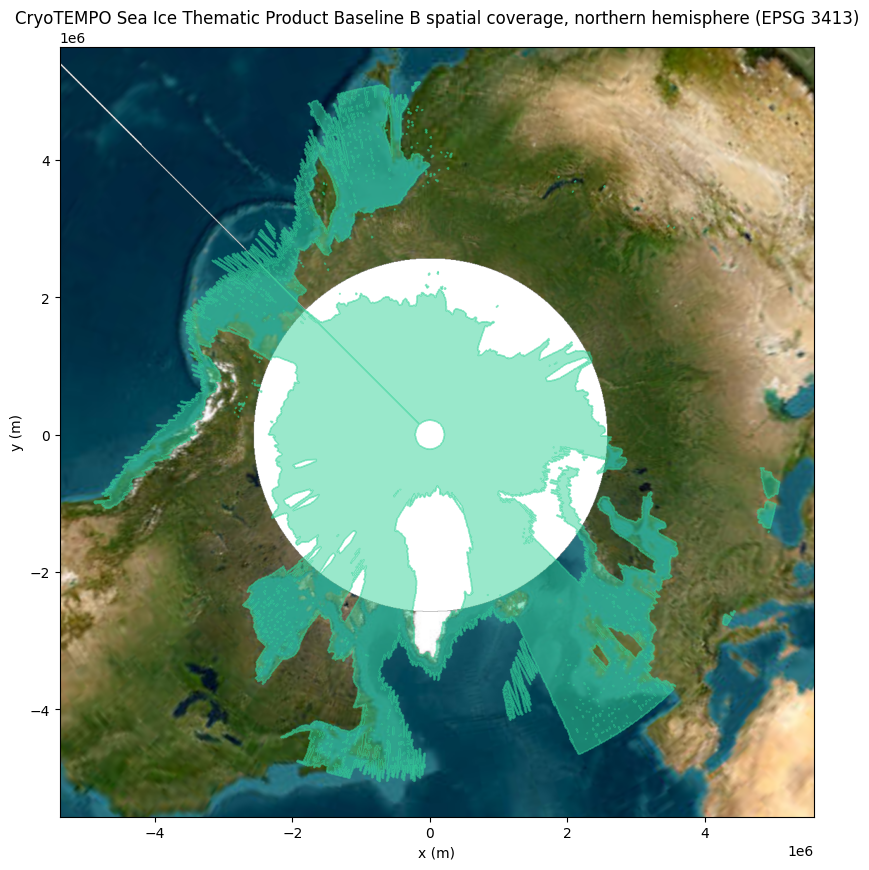
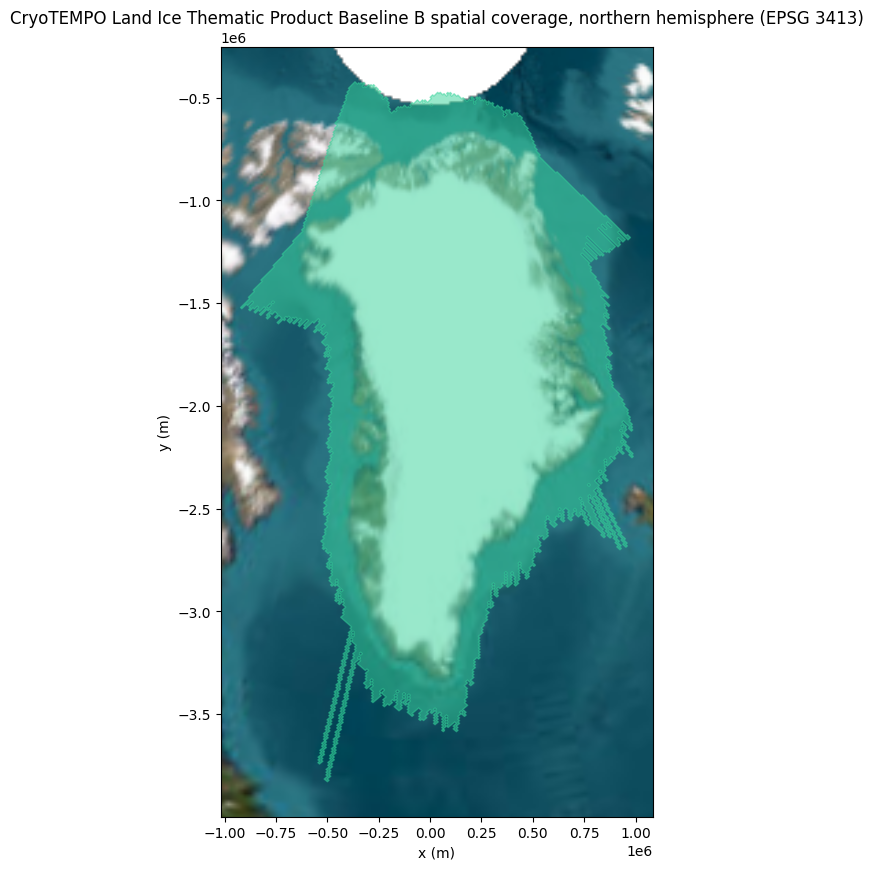
Plot dataset spatial coverage
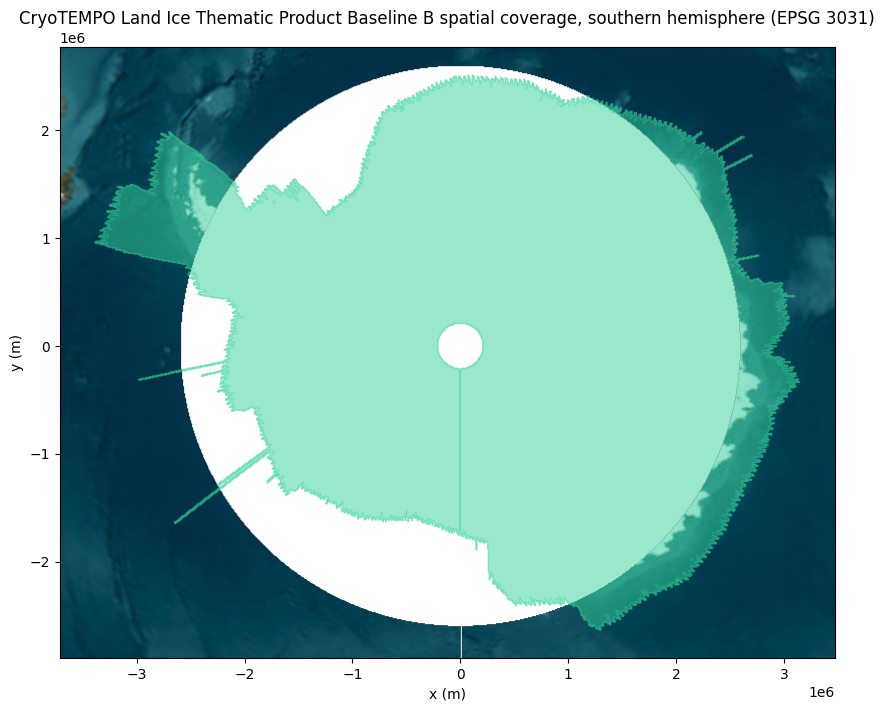
Let’s plot the geospatial coverage of the CryoTEMPO Polar Oceans, Sea Ice and Land Ice datasets, using Contextily to add a satellite background map. All background satellite imagery tiles are provided by the Esri World Imagery Service via Contextily.
[3]:
available_datasets = client.list_datasets()

cryotempo_datasets = {}
dataset_names = [
    "CryoTEMPO Polar Ocean Thematic Product Baseline B",
    "CryoTEMPO Sea Ice Thematic Product Baseline B",
    "CryoTEMPO Land Ice Thematic Product Baseline B",
]

for ds_name in dataset_names:
    cryotempo_datasets[ds_name] = available_datasets[available_datasets["dataset_name"] == ds_name].iloc[0]

    print(
        f"{ds_name} contains data timestamped between \n"
        f"{cryotempo_datasets[ds_name]['min_timestamp']} "
        f"and {cryotempo_datasets[ds_name]['max_timestamp']}\n"
    )

    print(f"{ds_name} has the following columns:")
    pprint.PrettyPrinter(indent=2, width=120).pprint(cryotempo_datasets[ds_name]["columns"])
    print("\n\n")

    desired_dataset_spatial_coverage = gpd.GeoDataFrame(
        geometry=[cryotempo_datasets[ds_name]["epsg4326_coverage"]], crs=4326
    )

    # we create two plots, one for each hemisphere, to minimise distortion
    # and illustrate that multiple regions may be present within the same dataset
    for crs, hemisphere_name, hemisphere_bounding_box in [
        (3413, "northern", (-180, 0, 180, 90)),
        (3031, "southern", (-180, -90, 180, 0)),
    ]:
        cropped_data = desired_dataset_spatial_coverage.clip(hemisphere_bounding_box)

        if len(cropped_data) > 0:
            transformed_cropped_data = cropped_data.to_crs(crs)
            ax = transformed_cropped_data.plot(
                figsize=(10, 10), alpha=0.5, color=data_coverage_color, edgecolor=data_coverage_color
            )

            ax.set_xlabel("x (m)")
            ax.set_ylabel("y (m)")
            ax.set_title(f"{ds_name} spatial coverage, {hemisphere_name} hemisphere (EPSG {crs})")

            # The basemap reprojection crashes when data crosses the top-left quadrant.
            # Draw the basemap as two hemispheres to get around this bug.
            xlim, ylim = ax.get_xlim(), ax.get_ylim()
            ax.set_xlim(1, 2)
            ax.set_ylim(1, 2)
            ctx.add_basemap(ax, source=ctx.providers.Esri.WorldImagery, crs=crs, attribution=False, zoom=1)
            ax.set_xlim(-2, -1)
            ax.set_ylim(-2, -1)
            ctx.add_basemap(ax, source=ctx.providers.Esri.WorldImagery, crs=crs, attribution=False, zoom=1)
            ax.set_xlim(*xlim)
            ax.set_ylim(*ylim)
CryoTEMPO Polar Ocean Thematic Product Baseline B contains data timestamped between
2010-08-01 00:37:22 and 2023-12-31 23:55:31

CryoTEMPO Polar Ocean Thematic Product Baseline B has the following columns:
[ { 'description': 'dynamic ocean topography',
    'max_value': 9.969209968386869e+36,
    'min_value': -32.98397505254174,
    'name': 'dynamic_ocean_topography',
    'type': 'float',
    'unit': 'm'},
  { 'description': 'Filtered dynamic ocean topography',
    'max_value': 9.969209968386869e+36,
    'min_value': -18.683891201057097,
    'name': 'dynamic_ocean_topography_filtered',
    'type': 'float',
    'unit': 'm'},
  { 'description': 'dynamic ocean topography uncertainty',
    'max_value': 9.969209968386869e+36,
    'min_value': 0.012529066903526604,
    'name': 'dynamic_ocean_topography_uncertainty',
    'type': 'float',
    'unit': 'm'},
  { 'description': 'SIRAL instrument mode flag - please refer to product handbook for flag value meaning',
    'max_value': 3.0,
    'min_value': 1.0,
    'name': 'instrument_mode',
    'type': 'float',
    'unit': 'NA'},
  { 'description': 'sea level anomaly',
    'max_value': 9.969209968386869e+36,
    'min_value': -32.76168093769796,
    'name': 'sea_level_anomaly',
    'type': 'float',
    'unit': 'm'},
  { 'description': 'inverse barometric range correction',
    'max_value': 9.969209968386869e+36,
    'min_value': -1.5924998212270827,
    'name': 'inverse_barometric',
    'type': 'float',
    'unit': 'm'},
  { 'description': 'Filtered sea level anomaly',
    'max_value': 9.969209968386869e+36,
    'min_value': -42352.73606459396,
    'name': 'sea_level_anomaly_filtered',
    'type': 'float',
    'unit': 'm'},
  { 'description': 'sea level anomaly unsmoothed 20 Hz values',
    'max_value': 9.969209968386869e+36,
    'min_value': -32.76168093769796,
    'name': 'sea_level_anomaly_raw',
    'type': 'float',
    'unit': 'm'},
  { 'description': 'sea level anomaly uncertainty',
    'max_value': 9.969209968386869e+36,
    'min_value': 0.004,
    'name': 'sea_level_anomaly_uncertainty',
    'type': 'float',
    'unit': 'm'},
  { 'description': 'region id - please refer to product handbook for flag value meaning',
    'max_value': 18.0,
    'min_value': 0.0,
    'name': 'region_code',
    'type': 'float',
    'unit': 'NA'}]


CryoTEMPO Sea Ice Thematic Product Baseline B contains data timestamped between
2010-11-01 00:22:24 and 2023-12-31 23:55:31

CryoTEMPO Sea Ice Thematic Product Baseline B has the following columns:
[ { 'description': 'SIRAL instrument mode flag - please refer to product handbook for flag value meaning',
    'max_value': 3.0,
    'min_value': 2.0,
    'name': 'instrument_mode',
    'type': 'float',
    'unit': 'NA'},
  { 'description': 'Radar freeboard',
    'max_value': 968.5565185546875,
    'min_value': -167.90652465820312,
    'name': 'radar_freeboard',
    'type': 'float',
    'unit': 'm'},
  { 'description': 'Radar freeboard uncertainty',
    'max_value': 0.1414213478565216,
    'min_value': 0.1019805297255516,
    'name': 'radar_freeboard_uncertainty',
    'type': 'float',
    'unit': 'm'},
  { 'description': 'region id - please refer to product handbook for flag value meaning',
    'max_value': 18.0,
    'min_value': 0.0,
    'name': 'region_code',
    'type': 'float',
    'unit': 'NA'},
  { 'description': 'freeboard of the sea ice layer',
    'max_value': 2.2499988079071045,
    'min_value': -0.25,
    'name': 'sea_ice_freeboard',
    'type': 'float',
    'unit': 'm'},
  { 'description': 'smoothed freeboard of the sea ice layer',
    'max_value': 66.54676604268523,
    'min_value': -19.452557027337747,
    'name': 'sea_ice_freeboard_filtered',
    'type': 'float',
    'unit': 'm'},
  { 'description': 'sea ice freeboard uncertainty',
    'max_value': 0.14916853606700897,
    'min_value': 0.1019805297255516,
    'name': 'sea_ice_freeboard_uncertainty',
    'type': 'float',
    'unit': 'm'},
  { 'description': 'snow depth',
    'max_value': 0.4512886530080971,
    'min_value': 0.0,
    'name': 'snow_depth',
    'type': 'float',
    'unit': 'm'},
  { 'description': 'snow depth uncertainty',
    'max_value': 0.19134312379075316,
    'min_value': 0.0,
    'name': 'snow_depth_uncertainty',
    'type': 'float',
    'unit': 'm'}]


CryoTEMPO Land Ice Thematic Product Baseline B contains data timestamped between
2010-07-16 00:08:47 and 2024-01-01 00:00:16

CryoTEMPO Land Ice Thematic Product Baseline B has the following columns:
[ { 'description': 'CryoSat SIRAL instrument operating mode - please refer to product handbook for flag value meaning',
    'max_value': 3.0,
    'min_value': 1.0,
    'name': 'instrument_mode',
    'type': 'float',
    'unit': 'NA'},
  { 'description': 'ice sheet elevation LMC Retracker',
    'max_value': 4666.404627441429,
    'min_value': -210.18170151300728,
    'name': 'elevation',
    'type': 'float',
    'unit': 'm'},
  { 'description': 'backscatter coefficient',
    'max_value': 62.6580864575041,
    'min_value': -54.502500548483525,
    'name': 'backscatter',
    'type': 'float',
    'unit': 'dB'},
  { 'description': 'surface type from mask - please refer to product handbook for flag value meaning',
    'max_value': 4,
    'min_value': 0,
    'name': 'surface_type',
    'type': 'int',
    'unit': 'NA'},
  { 'description': 'reference elevation from external Digital Elevation Model',
    'max_value': 4640.933787743923,
    'min_value': -329.80018062294215,
    'name': 'reference_dem',
    'type': 'float',
    'unit': 'm'},
  { 'description': 'Glacialogical basin identification number',
    'max_value': 27,
    'min_value': 0,
    'name': 'basin_id',
    'type': 'int',
    'unit': 'basin number'},
  { 'description': 'Glacialogical basin identification number',
    'max_value': 19,
    'min_value': -24,
    'name': 'basin_id2',
    'type': 'int',
    'unit': 'basin number'},
  { 'description': 'uncertainty of elevation parameter',
    'max_value': 2.415915353790031,
    'min_value': 0.11680662750683299,
    'name': 'uncertainty',
    'type': 'float',
    'unit': 'm'}]
Define area of interest
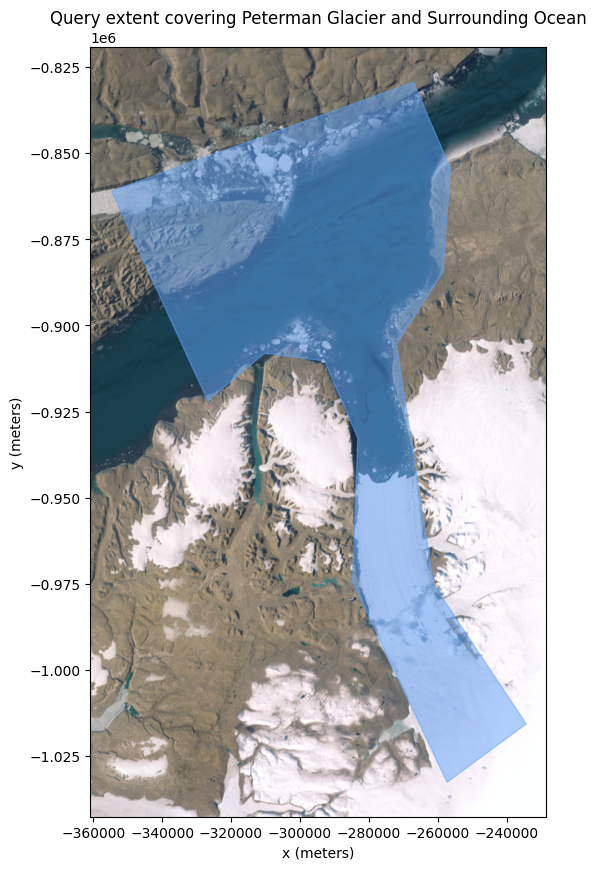
Lets define a rough boundary encompassing the terminus of Petermann Glacier and the adjacent ocean..
[4]:
petermann_extent = shapely.Polygon(
    (
        (-64.53, 80.99),
        (-63.87, 81.16),
        (-62.84, 81.19),
        (-61.9, 81.02),
        (-61.3, 80.65),
        (-59.0, 80.2),
        (-58.0, 80.4),
        (-60.0, 80.7),
        (-61.73, 81.29),
        (-61.3, 81.51),
        (-61.71, 81.78),
        (-62.86, 81.97),
        (-67.4, 81.42),
        (-64.53, 80.99),
    )
)
petermann_extent_gdf = gpd.GeoSeries(petermann_extent, crs=4326)

ax = petermann_extent_gdf.to_crs(nps_epsg_code).plot(
    figsize=(10, 10), alpha=0.5, color=geo_filter_colour, edgecolor=geo_filter_colour
)

ax.set_xlabel("x (meters)")
ax.set_ylabel("y (meters)")
ax.set_title("Query extent covering Peterman Glacier and Surrounding Ocean")
ctx.add_basemap(ax, source=ctx.providers.Esri.WorldImagery, crs=nps_epsg_code, attribution=False, zoom=8)
Query data
Now that we’ve defined our query extent, lets retrieve data from the CryoTEMPO Polar Ocean Thematic Product, CryoTEMPO Sea Ice Thematic Product, and CryoTEMPO Land Ice Thematic Product from Specklia.
Whilst we do so, we’ll apply some uncertainty filtering and filter the CryoTEMPO Land Ice data on surface type to retrieve measurements from grounded (surface_type=1) and floating ice (surface_type=2) only. Note that the surface type definitions can be found in the CryoTEMPO Product Handbook.
[5]:
cryotempo_data = {}
sources = {}
query_parameters = {
    "CryoTEMPO Polar Ocean Thematic Product Baseline B": {
        "filters": [{"column": "sea_level_anomaly_uncertainty", "operator": "<=", "threshold": 0.05}],
        "columns": ["sea_level_anomaly_filtered", "timestamp"],
    },
    "CryoTEMPO Sea Ice Thematic Product Baseline B": {
        "filters": [{"column": "sea_ice_freeboard_uncertainty", "operator": "<=", "threshold": 0.15}],
        "columns": ["sea_ice_freeboard_filtered", "timestamp"],
    },
    "CryoTEMPO Land Ice Thematic Product Baseline B": {
        "filters": [
            {"column": "uncertainty", "operator": "<=", "threshold": 1.5},
            {"column": "surface_type", "operator": ">=", "threshold": 1.0},
            {"column": "surface_type", "operator": "<=", "threshold": 2.0},
        ],
        "columns": ["elevation", "reference_dem", "timestamp", "surface_type"],
    },
}

for ds_name in dataset_names:
    dataset = available_datasets[available_datasets["dataset_name"] == ds_name].iloc[0]
    query_start_time = perf_counter()
    cryotempo_data[ds_name], sources[ds_name] = client.query_dataset(
        dataset_id=dataset["dataset_id"],
        epsg4326_polygon=petermann_extent,
        min_datetime=datetime(2011, 1, 1),
        max_datetime=datetime(2023, 12, 1),
        columns_to_return=query_parameters[ds_name]["columns"],
        additional_filters=query_parameters[ds_name]["filters"],
    )

    print(f"Query took {perf_counter() - query_start_time:.2f} seconds to complete.")
    print(
        f"{ds_name} Query complete, {len(cryotempo_data[ds_name])} points returned, "
        f"drawn from {len(sources[ds_name])} original sources."
    )
    print(f"Columns within the data: {cryotempo_data[ds_name].columns}\n\n")
Query took 91.51 seconds to complete.
CryoTEMPO Polar Ocean Thematic Product Baseline B Query complete, 296802 points returned, drawn from 1453 original sources.
Columns within the data: Index(['sea_level_anomaly_filtered', 'timestamp', 'source_id', 'source_row_id',
       'geometry'],
      dtype='object')


Query took 37.61 seconds to complete.
CryoTEMPO Sea Ice Thematic Product Baseline B Query complete, 21309 points returned, drawn from 805 original sources.
Columns within the data: Index(['sea_ice_freeboard_filtered', 'timestamp', 'source_id', 'source_row_id',
       'geometry'],
      dtype='object')


Query took 59.46 seconds to complete.
CryoTEMPO Land Ice Thematic Product Baseline B Query complete, 83055 points returned, drawn from 1460 original sources.
Columns within the data: Index(['elevation', 'reference_dem', 'timestamp', 'surface_type', 'source_id',
       'source_row_id', 'geometry'],
      dtype='object')
Analyse short and long-term trends
We next define some functions to help us disseminate the point data we’ve retrieved and analyse short and long term trends in the data.
[6]:
def calculate_linear_trend(point_data_gdf: gpd.GeoDataFrame, column_name: str) -> Tuple[NDArray, NDArray, str]:
    """
    Find the line of best fit for the point data using least squares linear regression.

    Format an associated label for the trend line in appropriate units for readability.

    Parameters
    ----------
    point_data_gdf : gpd.GeoDataFrame
        Point data for data set.
    column_name : str
        Column in point data geodataframe to apply least squares method to.

    Returns
    -------
    Tuple[NDArray, NDArray, str]
        The X-values, Y-values, and label for plotting the trend line.
    """
    # remove nan values to avoid propagation in regression
    filtered_point_data_gdf = point_data_gdf.loc[point_data_gdf[column_name].notna()].copy()

    # trend line
    m, c = np.linalg.lstsq(
        np.vstack([filtered_point_data_gdf.timestamp.to_numpy(), np.ones(len(filtered_point_data_gdf))]).T,
        filtered_point_data_gdf[column_name].to_numpy(),
        rcond=None,
    )[0]
    # generate x coordinates (timestamps in seconds) in 30 day intervals
    x_coords = np.arange(
        filtered_point_data_gdf.timestamp.min(), filtered_point_data_gdf.timestamp.max(), 60 * 60 * 24 * 30
    )
    y_trend_line = m * x_coords + c
    x_datetime = [datetime.fromtimestamp(x) for x in x_coords]

    # format trend units to make them more readable
    meter_per_year_trend = m * 60 * 60 * 24 * 365
    order_of_magnitude = math.floor(math.log(abs(meter_per_year_trend), 10))
    if order_of_magnitude <= -3:
        unit = "mm"
        rounded_scaled_trend = round(meter_per_year_trend / 10**order_of_magnitude, 2)
    elif order_of_magnitude == -2:
        unit = "cm"
        rounded_scaled_trend = round(meter_per_year_trend / 10**order_of_magnitude, 2)
    else:
        unit = "m"
        rounded_scaled_trend = round(meter_per_year_trend, 2)

    label = f"trend: {rounded_scaled_trend} {unit}/y"
    return x_datetime, y_trend_line, label


def calculate_monthly_average_time_series(point_data_gdf: gpd.GeoDataFrame, column_name: str) -> gpd.GeoDataFrame:
    """
    Calculate monthly average of point data for full timespan.

    Note that centre date of each month has been set to the 15th for simplicity.

    Parameters
    ----------
    point_data_gdf : gpd.GeoDataFrame
        Point data for data set.
    column_name : str
        Column in point data geodataframe to calculate monthly average of.

    Returns
    -------
    gpd.GeoDataFrame
        Contains monthly average of selected column and centre date of each month.
    """
    point_data_gdf["centre_month"] = [
        datetime(datetime.fromtimestamp(t).year, datetime.fromtimestamp(t).month, 15) for t in point_data_gdf.timestamp
    ]
    filtered_point_data_gdf = point_data_gdf.loc[point_data_gdf[column_name].notna()].copy()
    monthly_average_df = filtered_point_data_gdf.groupby(by="centre_month").agg({column_name: "mean"}).reset_index()
    return monthly_average_df
Using these functions we’ve defined we can calculate and plot changes in sea level, sea ice thickness, ice shelf elevation and land ice elevation over time.
[7]:
fig, axes = plt.subplots(figsize=(15, 5 * (len(cryotempo_data) + 1)), nrows=len(cryotempo_data) + 1)

for i, (ds_name, gdf) in enumerate(cryotempo_data.items()):
    # define our columns of interest in the different datasets
    if ds_name == "CryoTEMPO Polar Ocean Thematic Product Baseline B":
        column_name = "sea_level_anomaly_filtered"
    elif ds_name == "CryoTEMPO Sea Ice Thematic Product Baseline B":
        column_name = "sea_ice_freeboard_filtered"
    elif ds_name == "CryoTEMPO Land Ice Thematic Product Baseline B":
        column_name = "elevation_difference"
        gdf["elevation_difference"] = gdf["elevation"] - gdf["reference_dem"]

    # remove underscores and capitalise for label
    y_label = column_name.replace("_", " ").title()

    if ds_name in [
        "CryoTEMPO Polar Ocean Thematic Product Baseline B",
        "CryoTEMPO Sea Ice Thematic Product Baseline B",
    ]:
        # plot point data in background
        axes[i].scatter(
            [datetime.fromtimestamp(t) for t in gdf.timestamp],
            gdf[column_name],
            s=0.5,
            c="lightgrey",
            label="point data",
        )

        # calculate and plot monthly average
        monthly_average_df = calculate_monthly_average_time_series(gdf, column_name)
        axes[i].plot(monthly_average_df["centre_month"], monthly_average_df[column_name], label="monthly average")

        # calcualte and plot linear trend
        x_datetime, y_trend_line, trend_label = calculate_linear_trend(gdf, column_name)
        axes[i].plot(x_datetime, y_trend_line, label=trend_label, c="red", ls="--")

        axes[i].set_title(f"Time series of {y_label} from the {ds_name}")
        ax.set_ylabel(y_label + " [metres]")

    elif ds_name == "CryoTEMPO Land Ice Thematic Product Baseline B":
        # we need to separate the floating ice from the grounded ice for the time series calculation
        for j, (surface_type_name, surface_type_id) in enumerate({"grounded ice": 1, "floating ice": 2}.items()):
            surface_type_gdf = gdf.loc[gdf["surface_type"] == surface_type_id].copy()
            # plot point data in background
            axes[i + j].scatter(
                [datetime.fromtimestamp(t) for t in surface_type_gdf.timestamp],
                surface_type_gdf[column_name],
                s=0.5,
                c="lightgrey",
                label="point data",
            )

            # calculate and plot monthly average
            monthly_average_df = calculate_monthly_average_time_series(surface_type_gdf, column_name)
            axes[i + j].plot(
                monthly_average_df["centre_month"], monthly_average_df[column_name], label="monthly average"
            )

            # calcualte and plot linear trend
            x_datetime, y_trend_line, trend_label = calculate_linear_trend(surface_type_gdf, column_name)
            axes[i + j].plot(x_datetime, y_trend_line, label=trend_label, c="red", ls="--")
            axes[i + j].set_ylim(-15, 15)
            axes[i + j].set_title(f"Time series of {y_label} over {surface_type_name} from the {ds_name}")
            ax.set_ylabel(y_label + " [metres]")

# format axes
for ax in axes:
    ax.legend(loc="upper right")
    ax.axhline(y=0, ls="--", c="black")
    ax.set_xlabel("Date")

plt.tight_layout()
plt.show()
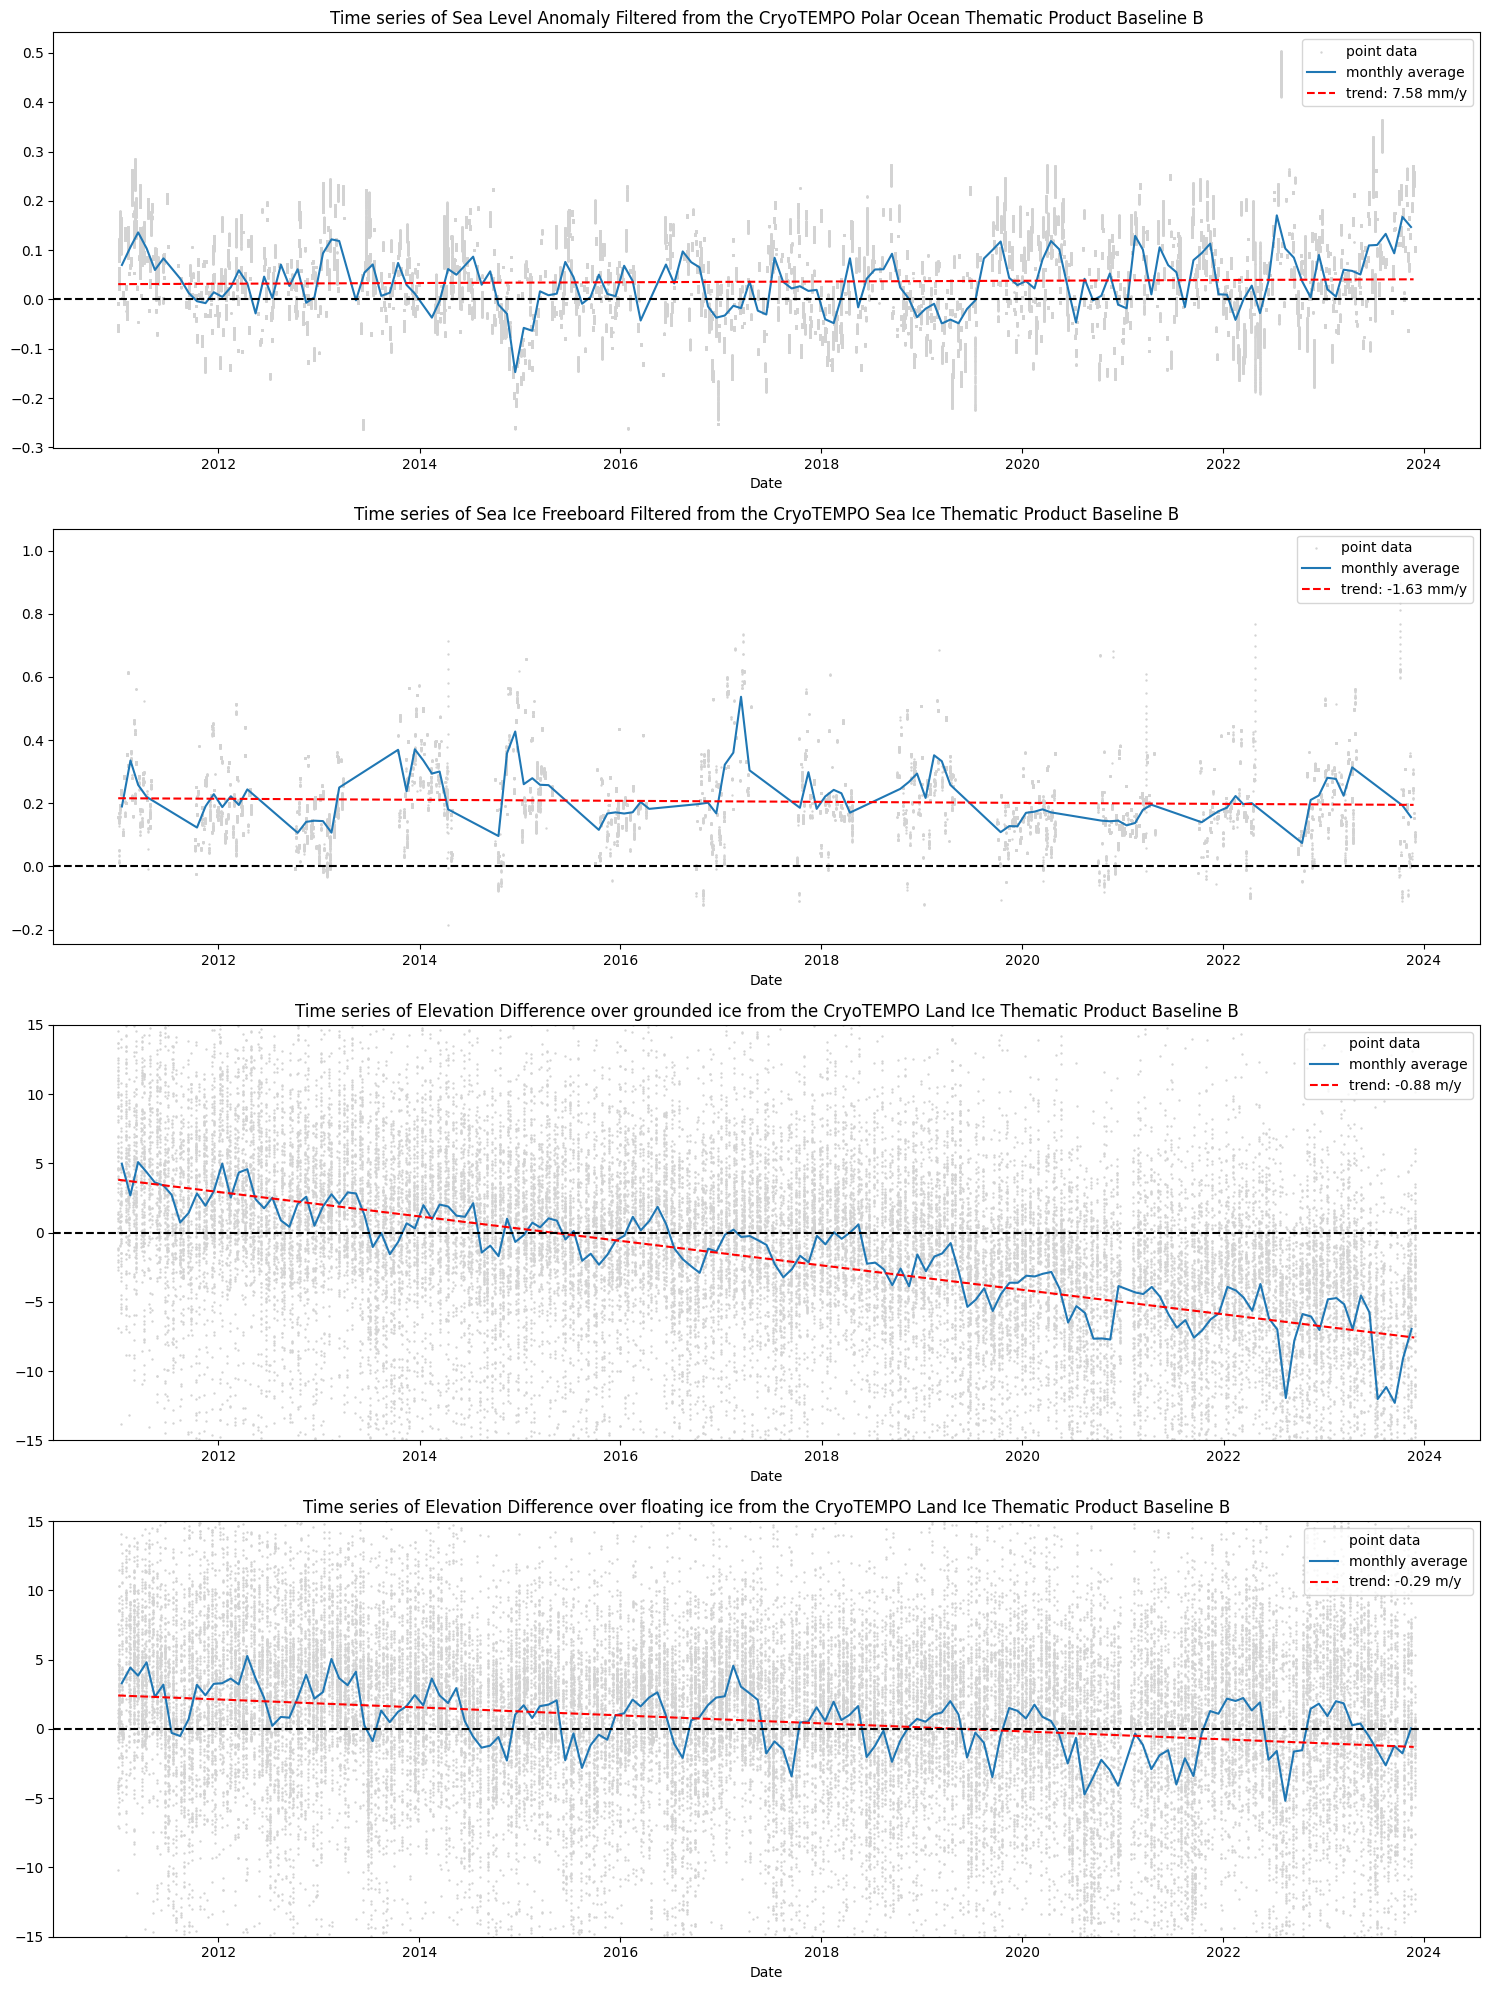
The monthly time series above allows us to see short term variations in each variable. Most notably, we see clear seasonality in the thickening of grounded ice (bottom left) and floating ice (bottom right) in winter months and thinning in summer months. Sea ice freeboard is only measured between October and April each year, however we see how the sea ice generally thickens and then thins through that time.
The long-term trend lines indicate a local sea level rise of 7.6 milimeter per year, with sea ice thinning by -1.6 milimeter per year, the Petermann Glacier ice shelf thinning by -0.3 metres per year, and grounded ice by 0.9 metres per year.
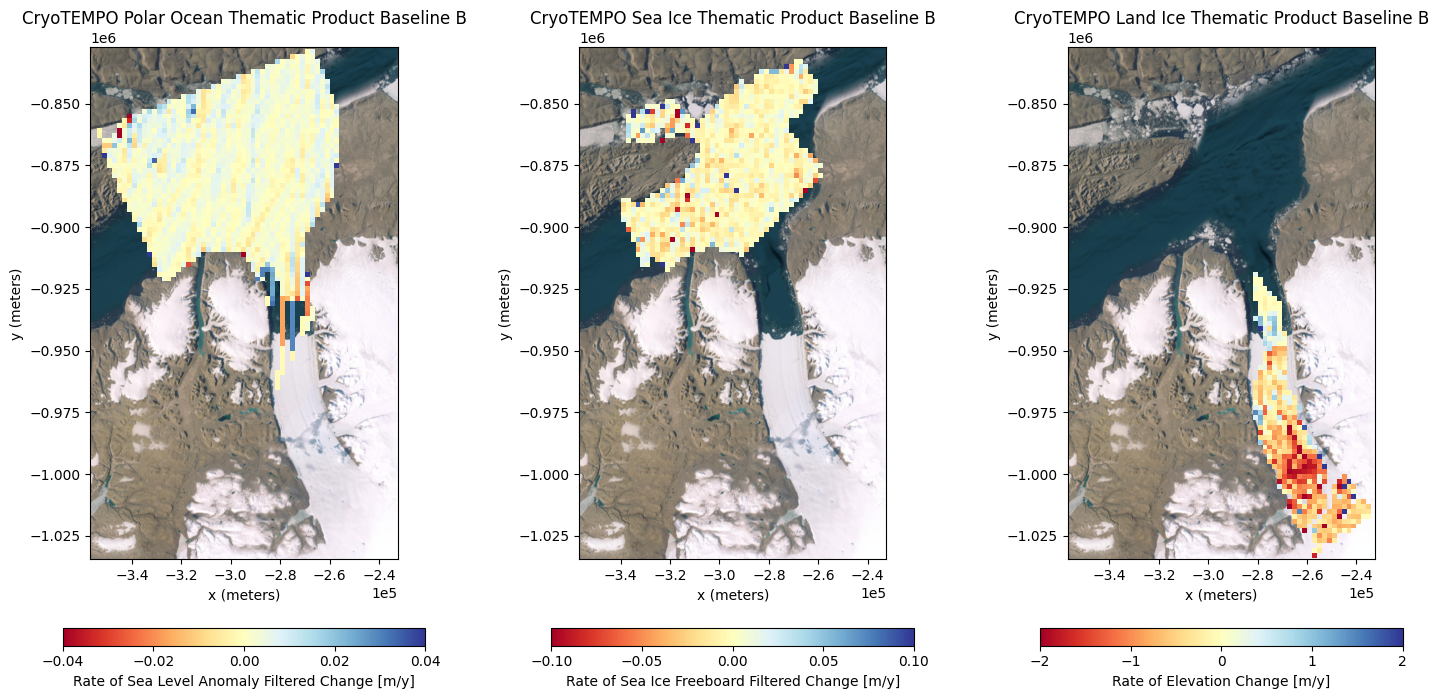
Map trends spatially
It can also be useful to visualise the rate of change of each of these variables spatially.
Below we define a function to calculate the linear trend through time at 2 kilometre resolution.
[8]:
def calculate_rate_of_change_map(
    point_data_gdf: gpd.GeoDataFrame, column_name: str, resolution: int, epsg_code: int
) -> gpd.GeoDataFrame:
    """
    Calculate the rate of change per pixel in years.

    Parameters
    ----------
    point_data_gdf : gpd.GeoDataFrame
        Point data for data set.
    column_name : str
        Column name of point data to calculate rate of change over.
    resolution : int
        Target resolution of rate of change map.
    epsg_code : int
        Projection code with units of measurement in metres.

    Returns
    -------
    gpd.GeoDataFrame
        Rate of change in years per pixel of defined resolution.
    """
    # reproject data so that x and y coordinates are in metres
    df_reprojected = point_data_gdf.to_crs(epsg_code)

    # group points per pixel
    df_reprojected["x_centre"] = [
        math.floor(x / resolution) * resolution + resolution / 2 for x in df_reprojected.geometry.x
    ]
    df_reprojected["y_centre"] = [
        math.floor(y / resolution) * resolution + resolution / 2 for y in df_reprojected.geometry.y
    ]
    pixel_groups = df_reprojected.groupby(by=["x_centre", "y_centre"])

    # apply least squares linear regression to data in each pixel
    rate_of_change = []
    pixel_geometries = []
    for pixel_coordinate, pixel_group in pixel_groups:
        pixel_group_df = pixel_group.sort_values(by="timestamp")
        pixel_group_df = pixel_group_df.loc[pixel_group_df[column_name].notna()]
        if pixel_group_df.empty:
            continue
        m, _ = np.linalg.lstsq(
            np.vstack([pixel_group_df["timestamp"].to_numpy(), np.ones(len(pixel_group_df))]).T,
            pixel_group_df[column_name].to_numpy(),
            rcond=None,
        )[0]

        # m gives the rate of change in meters per second (as timestamp is seconds), lets crudely convert it to
        # metres per years for a more meaningful value
        rate_of_change_meters_per_year = m * 60 * 60 * 24 * 365

        # append results to list
        rate_of_change.append(rate_of_change_meters_per_year)
        pixel_geometries.append(
            shapely.Polygon(
                (
                    (pixel_coordinate[0] + resolution / 2, pixel_coordinate[1] + resolution / 2),
                    (pixel_coordinate[0] + resolution / 2, pixel_coordinate[1] - resolution / 2),
                    (pixel_coordinate[0] - resolution / 2, pixel_coordinate[1] - resolution / 2),
                    (pixel_coordinate[0] - resolution / 2, pixel_coordinate[1] + resolution / 2),
                    (pixel_coordinate[0] + resolution / 2, pixel_coordinate[1] + resolution / 2),
                )
            )
        )

    # create geodataframe containing gridded rate of change values
    rate_of_change_gdf = gpd.GeoDataFrame(
        {f"Rate of {column_name.replace('_', ' ').title()} Change [m/y]": rate_of_change},
        geometry=pixel_geometries,
        crs=epsg_code,
    )
    return rate_of_change_gdf
Finally, we can calculate and plot these rate of change maps for each dataset where, most notably, we see the significant thinning of Peterman Glacier.
[9]:
# target resolution of rate of change map in metres
resolution = 2000

fig, axes = plt.subplots(figsize=(5 * len(cryotempo_data), 7.5), ncols=len(cryotempo_data))
min_x, min_y, max_x, max_y = petermann_extent_gdf.to_crs(nps_epsg_code).total_bounds
for i, (ds_name, gdf) in enumerate(cryotempo_data.items()):
    # define columns to fit regression to
    if ds_name == "CryoTEMPO Polar Ocean Thematic Product Baseline B":
        column_name = "sea_level_anomaly_filtered"
    elif ds_name == "CryoTEMPO Sea Ice Thematic Product Baseline B":
        column_name = "sea_ice_freeboard_filtered"
    elif ds_name == "CryoTEMPO Land Ice Thematic Product Baseline B":
        column_name = "elevation"

    # calculate rate of change map
    rate_of_change_gdf = calculate_rate_of_change_map(gdf, column_name, resolution, nps_epsg_code)

    # plot rate of change map
    rate_of_change_col = rate_of_change_gdf.columns[0]
    std = rate_of_change_gdf[rate_of_change_col].std()

    # define colorbar bounds and spacing for tick labels
    order_of_magnitude = math.floor(math.log(std, 10))
    vmin = round(-2 * std, abs(order_of_magnitude))
    vmax = round(2 * std, abs(order_of_magnitude))
    spacing = round((vmax - vmin) / 4, abs(order_of_magnitude))

    rate_of_change_gdf.plot(
        rate_of_change_col,
        ax=axes[i],
        legend=True,
        vmin=vmin,
        vmax=vmax,
        cmap="RdYlBu",
        legend_kwds={
            "label": rate_of_change_col,
            "orientation": "horizontal",
            "shrink": 0.8,
            "pad": 0.1,
            "ticks": np.arange(vmin, vmax + spacing, spacing),
        },
    )

    # add background map
    axes[i].set_xlim(min_x - resolution, max_x + resolution)
    axes[i].set_ylim(min_y - resolution, max_y + resolution)
    ctx.add_basemap(axes[i], source=ctx.providers.Esri.WorldImagery, crs=nps_epsg_code, attribution=False, zoom=8)

    # format axis
    axes[i].ticklabel_format(scilimits=(0, 2))
    axes[i].set_xlabel("x (meters)")
    axes[i].set_ylabel("y (meters)")
    axes[i].set_title(ds_name)
plt.tight_layout()
plt.show()